If you see a bridge on the verge of collapse, you act. A full picture of ocean industrialization helps us understand human activity at sea and perhaps, the limits of the big blue.
From one famous image to big data
The first image of the blue planet was taken more than 50 years ago.
Now we have numerous open source, big data analyses, dashboards and detailed maps. They make it easier to get the full picture: Overfishing, CO2 emissions, ocean acidification, sea surface temperatures and offshore wind farms to mention a few. We can all see it with our own eyes. These tools must be used to avoid the tragedy of the commons, climate tipping points and extinction of marine life.
By the way, I think “ocean industrialization” is a more sober and precise terminology and conceptualisation than the “blue economy” which has a bit of a “hidden hand” feel to what is our foundations of life.
Industrialization in this context is what it’s always been about: Extracting and harvesting natural resources with heavy machinery. We need to keep and develop the industry that is necessary to reach a sustainable, net zero emissions future, and leave the rest of it for the history books.
Humans use the equivalent of 1.6 Earths to maintain the current way of life. Ecosystems cannot keep up with our demands.
Mapping ocean industrialization
The reason I write this post is an article in Nature I came across about ocean industrialization. This is what the authors say in the introduction and what they find:
- The world’s population increasingly relies on the ocean for food, energy production and global trade. Yet human activities at sea are not well quantified.
- They combine satellite imagery, vessel GPS data and deep-learning models to map industrial vessel activities and offshore energy infrastructure across the world’s coastal waters from 2017 to 2021.
- Offshore wind is growing rapidly. With most wind turbines confined to small areas of the ocean but surpassing the number of oil structures in 2021.
- The researchers further find that 72–76% of the world’s industrial fishing vessels are not publicly tracked, with much of that fishing taking place around South Asia, Southeast Asia and Africa.
- They also find that 21–30% of transport and energy vessel activity is missing from public tracking systems.
- Globally, fishing decreased by 12 ± 1% at the onset of the COVID-19 pandemic in 2020 and had not recovered to pre-pandemic levels by 2021. By contrast, transport and energy vessel activities were relatively unaffected during the same period.
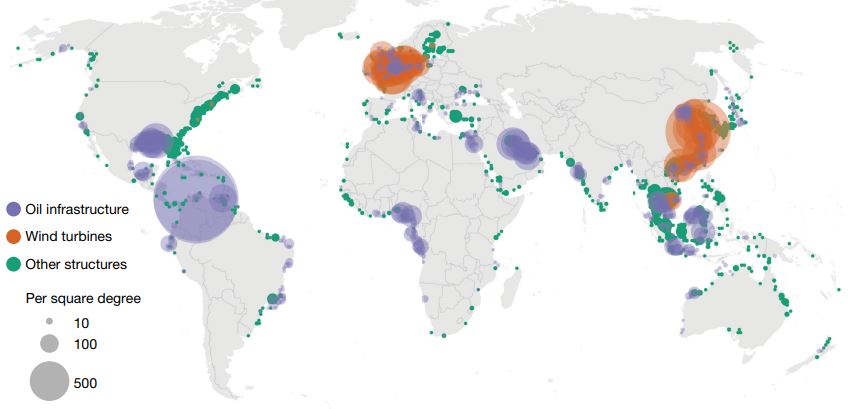
Nature article map: The map of ocean industrialization reveals changes in some of the most extensive and economically important human activities at sea.
More mapping
Some other maps and dashboards that can help seeing the full picture:
Climate TRACE: Unveils open emissions database of more than 352 million assets, with a nicely animated globe.
Plan Bleu / UNEP: Interactive map with several filters related to sustainable management of the ocean.
Fishing Watch: Satellite radar imagery that help to reveal the true scale of hidden fishing
Marine Protection: Map showing fishing protection levels
Offshore Wind Farms Database: Tracks offshore wind farms projects planned, under construction and operational.
Google Sea Level Rise and the Fate of Coastal Cities: How much of big cities will be under water under 2 and 4 degrees temperature rise scenarios?
Cover photo: Sunset southeast of Norway


